
A time-of-use (TOU) plan charges different prices for electricity depending on the hour of the day. Peak prices are usually highest in the late afternoon and evening, and off-peak prices are lowest overnight. The flat U.S. average of 18.16 cents per kWh is a benchmark for a non-TOU plan, not a TOU price. In the illustrative example below, shifting 100 kWh of use from peak to off-peak hours saves about $20 per month at made-up TOU prices of 12 cents off-peak and 32 cents on-peak. Your utility’s actual windows and prices decide the real saving.
- What a time-of-use plan is
- Rates compared with the flat average
- An illustrative example: 900 kWh a month
- Shifting use: the saving per kilowatt-hour
- Which loads are easy to shift
- Pre-cooling and thermostat strategy
- Checking your plan before you switch
- Seasonal and weekend structure
- Demand charges and TOU plans
- How utilities set peak windows
- Batteries and electric vehicles on TOU
- Reviewing the plan once a year
- Records for a fair comparison
- Practical steps for a TOU household
- Frequently asked questions
- Sources and method
What a time-of-use plan is
A TOU plan divides the day into periods, each with its own price. A typical plan has an off-peak period overnight, a shoulder or mid-peak period during the day, and a peak period in the late afternoon and early evening, when demand is highest. The price for each period is set by the utility or the retail supplier and approved under the plan’s terms. Periods can differ by season and by weekday or weekend.
The purpose of a TOU plan is to send a price signal. When electricity is expensive to produce or deliver, the price is higher, and a household can respond by moving flexible use to cheaper hours. A household that does not shift use may pay more on a TOU plan than on a flat plan, while a household that shifts use can pay less.
Rates compared with the flat average
The table below shows the EIA August 2026 residential average for reference. TOU prices are not published as one state average, so the table compares the flat rate only, and the TOU figures in the examples are illustrative.
| Benchmark (EIA August 2026 average) | Rate |
|---|---|
| United States, flat residential | 18.16 cents/kWh |
| Washington | 14.63 cents/kWh |
| Texas | 15.91 cents/kWh |
| California | 29.75 cents/kWh |
A flat benchmark is useful when comparing a TOU plan with a non-TOU plan. For a household that uses the same kilowatt-hours every hour, the flat plan may be the simpler choice. For a household that can shift use, the TOU plan may be cheaper.
An illustrative example: 900 kWh a month
The example below uses made-up prices to show how the math works. The off-peak price is 12 cents, and the peak price is 32 cents. The household uses 630 kWh off-peak and 270 kWh at peak in the month, which is 70 percent off-peak and 30 percent peak.
| Plan (900 kWh per month, illustrative) | Energy charge |
|---|---|
| Flat plan at the U.S. average, 18.16 cents | $163.44 |
| Illustrative TOU plan, 630 kWh at 12 cents plus 270 kWh at 32 cents | $162.00 |
In this example, the two plans cost almost the same, because the usage mix is close to the flat average. The TOU plan saves money only when the household moves use from peak to off-peak hours.
Shifting use: the saving per kilowatt-hour
Each kilowatt-hour moved from the peak period to the off-peak period saves the difference between the two prices. In the illustrative example, that difference is 20 cents per kWh, so moving 100 kWh saves $20 per month, or about $240 per year if the same shift repeats every month. Moving 200 kWh saves $40 per month.
The shift does not need to be large to matter. A few common loads, moved out of the peak window, can add up. The saving depends on how much of the household’s flexible use falls in the peak window, and on how easily the household can move it.
Which loads are easy to shift
Some loads can move without a change in comfort or routine. A dishwasher, a washer and dryer, an EV charger, a pool pump, and a water heater with a timer are common examples. Schedule these to run in the off-peak period when the plan allows.
Other loads are harder to move. Cooling and heating depend on the indoor temperature, and a thermostat can pre-cool or pre-heat the house before the peak window, with a few degrees of drift during the peak. Lighting and cooking are usually used when needed, but efficient bulbs and efficient cooking reduce the total use in any window.
Pre-cooling and thermostat strategy
A common strategy is to cool the house during the off-peak period, then allow a small rise in temperature during the peak window. The house stores some coolness in its walls and furniture, so the air conditioner runs less during the peak. The effect depends on the house’s insulation and the outdoor temperature. Test the approach for a week, and check the bill and the comfort.
A programmable or smart thermostat can automate the schedule. Set the peak window and a comfortable temperature range, and let the thermostat manage the cooling load.
Checking your plan before you switch
Read the plan’s peak and off-peak windows, the seasonal rules, and the weekday and weekend structure. Check whether the plan has a fixed monthly charge, a delivery charge, or a demand charge. A demand charge is based on the highest rate of use in a period, which can change the math for a household that runs several large loads at once.
Compare the total estimated bill under both plans, using your own usage by hour. Many utilities provide an online bill calculator or a usage report that shows the hourly pattern. Use it to see how the TOU plan would have billed last year.
Seasonal and weekend structure
TOU plans often change by season. Summer peaks tend to be longer and more expensive, because cooling demand is high, and winter peaks may be shorter or differently timed. Some plans apply a different schedule on weekends and holidays, when demand is lower. Read the calendar on the plan, not only the daily hours, and mark the season changes on a household calendar so the schedule is easy to follow.
A household with a summer cooling load on a TOU plan may see the largest peak charges in the hottest months. Pre-cooling, shade, and thermostat setbacks are most useful in those months, because they reduce the energy used in the most expensive hours.
Demand charges and TOU plans
Some plans include a demand charge, which is based on the highest rate of use during a billing period rather than the total kilowatt-hours. A demand charge can add a large amount for a household that runs several high-power loads at the same time, such as an EV charger, an electric oven, and an air conditioner. Scheduling large loads to run one at a time, or spreading them across different hours, can reduce the peak demand that the charge is based on.
Check your plan for a demand charge before you compare offers. A plan with no demand charge may suit a household with several large loads better than a plan that includes one.
How utilities set peak windows
Utilities set TOU windows based on the timing of their system’s demand and the cost of meeting it. The peak window often falls in the late afternoon and early evening, when people return home and turn on lights, cooking appliances, and air conditioners. The windows may be adjusted over time as demand patterns change. Check the utility’s notices for changes, and keep a copy of the schedule in the same place as your bills.
Batteries and electric vehicles on TOU
Home batteries and EV chargers are common loads on TOU plans. A battery can store energy during off-peak hours and supply the home during the peak window, which can reduce the peak purchase. An EV charger can schedule charging for the off-peak window, and the car is ready the next morning. Both options depend on the plan’s rates and on the household’s usage. Compare the savings with the cost of the equipment and the installation before deciding.
The savings from a battery or an EV schedule depend on the size of the shift and the price difference between the windows. An illustrative 20-cent difference, applied to 100 kWh a month, saves $20 per month, as shown above. The actual saving depends on the plan’s prices.
Reviewing the plan once a year
Look at the plan once a year, using the hourly usage data from the utility. The data shows how much use fell into the peak window, and whether the household’s habits changed over the year. If the peak use is high, consider shifting more loads, adjusting the thermostat, or comparing another plan. If the peak use is low, the current plan may suit the household well.
Keep the annual totals in a simple table. The table shows the change in the bill from year to year, and it makes a comparison with another plan easier.
Records for a fair comparison
Keep the bills, the plan details, the hourly data, and any notices about changes in one folder. Note the date each change took effect, and compare the bills before and after. The record makes it possible to see whether a bill increase came from a rate change, a plan change, a change in usage, or a change in the season.
Practical steps for a TOU household
Learn the peak window. Note the hours, the days, and the season for your plan.
Move flexible loads. Set timers and scheduling features for the dishwasher, the washer, the EV, and the pool.
Use the thermostat. Pre-cool or pre-heat before the peak window, and avoid large temperature swings during it.
Check your usage. Review the hourly data after a month, to see where the peak use happens.
Compare plans once a year. Check whether another plan suits the pattern of use.
Frequently asked questions
Is a TOU plan always cheaper? No. It saves money for households that can shift use out of the peak window. Households that use most of their electricity in the evening may pay more.
What does off-peak mean? It is the period with the lowest price, usually overnight. The exact hours depend on the plan.
Do TOU prices change by season? Some plans do. Check the plan’s seasonal schedule for summer and winter.
Can I calculate my TOU bill? Yes. Multiply the kilowatt-hours used in each period by the price for that period, then add the other charges on the bill.
What would this cost in your home?
Adjust the starting values to match your appliance and electricity plan.
Sources and method
Monthly energy charge equals the kilowatt-hours used in each period multiplied by that period’s price. The flat U.S. average of 18.16 cents per kWh comes from the EIA Electric Power Monthly, Table 5.6.A for August 2026, and the state values in the benchmark table come from the same source. The TOU prices of 12 cents off-peak and 32 cents peak, the 900 kWh usage, and the 70 and 30 percent split are illustrative values for explanation, not the prices of any utility or supplier. The U.S. Department of Energy Energy Saver site gives general guidance on time-of-use and home energy use.
For a state benchmark, see our U.S. electricity rates by state hub and our California electricity cost guide.
Written by Seon (Site Founder & Energy Data Researcher / Home Tech Reviewer). Last checked: November 22, 2026. These are calculated estimates from EIA average rates and an illustrative example, not measured results.
Maine vs. New Hampshire Electricity Cost: Winter Heat Pump & Delivery Bills
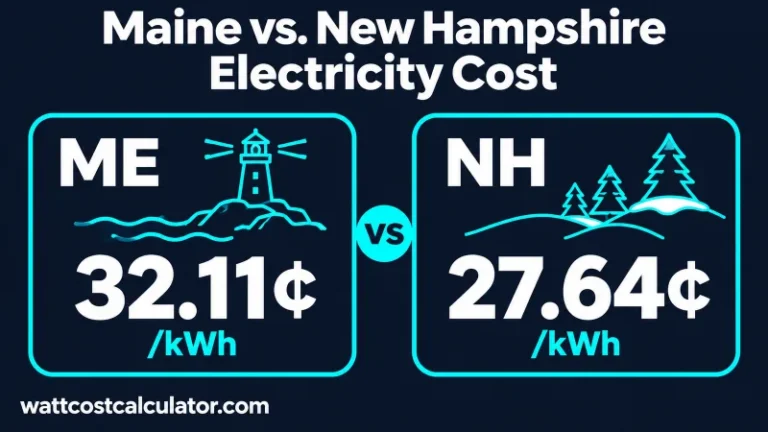
Residential electricity in Maine averaged 32.11¢/kWh in August 2026 (EIA), compared with 27.64¢/kWh in New Hampshire—making a 700 kWh monthly bill $31.29...

2026 US State-by-State Electricity Cost Master Guide
Compare electricity prices across U.S. states using EIA data: the five most expensive and cheapest states, plus California, Texas, Florida and New...

U.S. Electricity Rates by State (2026 Comparison Hub)
Compare residential electricity prices in all 50 states and DC, using EIA August 2026 data with August 2025 for comparison, and jump...

Illinois vs Ohio Electricity Cost: Supply Rates and the Total Bill
Table of ContentsHideWhat the same usage costs at state averagesPrice to Compare: a supply benchmark, not the entire billWhy a lower supplier...