
Florida’s average residential rate is 14.99 cents per kWh, Texas’s is 15.91 cents, and California’s is 29.75 cents, all from EIA Table 5.6.A for August 2026. For a reference home that uses 1,000 kWh a month, the energy charge is about $149.90 in Florida, $159.10 in Texas, and $297.50 in California. California’s energy charge is about double Florida’s, and the gap is roughly $1,771 per year at the same usage. The three states differ mainly in rate, and the rate reflects the cost of generation, delivery, and each state’s market structure.
- What the three averages show
- Rates and the reference home
- Cooling in Florida and Texas
- Appliances at each state’s rate
- Electric vehicle charging across the three states
- Heating in Florida and Texas
- Solar and storage in the three states
- Rate changes and rate cases
- A simple comparison method
- Choosing where to live: a simple framework
- Why averages can mislead
- Time-of-use and tiered plans
- Why the rates differ
- Practical steps in any of the three states
- Frequently asked questions
- Sources and method
Florida’s average residential rate is 14.99 cents per kWh, Texas’s is 15.91 cents, and California’s is 29.75 cents, all from EIA Table 5.6.A for August 2026. For a reference home that uses 1,000 kWh a month, the energy charge is about $149.90 in Florida, $159.10 in Texas, and $297.50 in California. California’s energy charge is about double Florida’s, and the gap is roughly $1,771 per year at the same usage. The three states differ mainly in rate, and the rate reflects the cost of generation, delivery, and each state’s market structure.
What the three averages show
The three states sit at very different points in the national table. Florida and Texas are both below the U.S. average of 18.16 cents, while California is well above it. Florida’s average is the lowest of the three in this comparison, and Texas’s is close to Florida’s. California’s average is high enough that its households pay nearly twice as much for each kilowatt-hour as Florida’s.
The averages are benchmarks for the energy charge only. They do not include delivery, fixed charges, taxes, or plan-specific fees. They also do not show tiered or time-of-use effects, which can change the effective rate for a particular household.
Rates and the reference home
The table below uses the EIA August 2026 residential averages from Table 5.6.A and applies them to the same 1,000 kWh reference home.
| Location (EIA August 2026 average) | Rate | Energy charge, monthly | Energy charge, annual |
|---|---|---|---|
| Florida | 14.99 cents/kWh | $149.90 | $1,798.80 |
| Texas | 15.91 cents/kWh | $159.10 | $1,909.20 |
| California | 29.75 cents/kWh | $297.50 | $3,570.00 |
The reference home is a planning value, not the average for any state. It makes the three states comparable on the same usage. At this usage, the gap between Florida and California is about $147.60 per month, or about $1,771 per year.
Cooling in Florida and Texas
Florida and Texas both have long, hot cooling seasons, and cooling is the largest load in many homes in both states. As a scenario, a 1,200 W window air conditioner running 8 hours a day for 31 days uses about 297.6 kWh. At Florida’s average rate, that costs about $44.61 for the month. At Texas’s rate, the same unit costs about $47.35. At California’s rate, it costs about $88.54. The difference between Florida and Texas is small, and the difference with California is large for the same load.
Florida’s cooling season can run for much of the year, which makes efficiency and thermostat habits important. Texas’s summer peaks are often the largest part of the bill. In both states, a higher thermostat setting during the day and a well-sealed home lower the load.
Appliances at each state’s rate
The table below applies each state’s rate to a refrigerator at 493 kWh per year, as a planning value from the published ENERGY STAR average in one analysis.
| Scenario (annual energy) | Florida (14.99) | Texas (15.91) | California (29.75) |
|---|---|---|---|
| Refrigerator at 493 kWh per year | $73.90 per year | $78.44 per year | $146.67 per year |
The refrigerator difference between Florida and California is about $73 per year. That is one appliance, running all year, and the gap multiplies across every appliance in a home.
Electric vehicle charging across the three states
An EV at home adds a large and steady load. As a scenario, a household that charges 300 kWh a month uses 3,600 kWh a year. At Florida’s average rate, that costs about $539.64 per year. At Texas’s rate, it costs about $572.76. At California’s rate, the same charging costs about $1,071.00 per year. The EV load is one of the clearest examples of how the rate choice changes a household’s annual budget.
An EV charger on a time-of-use plan can shift most charging to the off-peak window. A household in California on a TOU plan with a cheap overnight window may cut the cost of the same charging substantially. Check each plan’s off-peak hours before deciding how and when to charge.
Heating in Florida and Texas
Florida’s winters are mild, and most homes need little heat for much of the year. Texas winters are generally milder than its summers, though cold snaps can raise the heating load for a few days. California’s coastal areas are mild in winter, while its inland and mountain areas are colder. The heating load in each state depends on the climate zone, the insulation, and the heating system’s efficiency, so the same rate can produce very different winter bills.
A heat pump is often an efficient heating choice in mild climates, and its performance drops in cold weather. A household in any of the three states should check the system’s rated efficiency for its climate, and set a thermostat schedule that matches its routine.
Solar and storage in the three states
Each state has its own rules for rooftop solar and for the value of exported energy. Florida and Texas have active solar markets, and the terms of a contract vary by provider. California has a long history of solar programs, and its rules for exported energy have changed over time. A solar system reduces the bill by offsetting the energy a household buys, and the value of that offset depends on the rate and on the program terms.
Battery storage is most useful where time-of-use rates create a large difference between peak and off-peak prices, because the battery can store cheap energy and supply the home during the peak. The value of storage depends on the plan, the system’s cost, and the household’s usage pattern.
Rate changes and rate cases
Rates change over time as costs and programs change. In each state, the regulator reviews utility costs and approves rate changes, and the approved rates take effect on a set date. A rate change can raise the bill even when usage stays the same. Keep the bills from before and after any change, so that the difference can be traced to the rate rather than to usage.
Check the utility’s notices and the regulator’s public records when a rate change is announced. A notice usually shows the expected impact on a typical bill, which is a useful reference point for your own usage.
A simple comparison method
To compare the three states for your own household, follow the same steps in each place. Start with your annual kilowatt-hours, which you can read from a year of bills. Multiply by the state’s average rate for the energy charge. Add the typical delivery, fixed, and tax lines for the utility that serves the area. Compare the results, and then look at the plan structure, the rebates, and the climate.
The result is an estimate of the total annual electricity cost for your home in each state. It is more accurate than the energy rate alone, because it includes the parts of the bill that the average does not show.
Choosing where to live: a simple framework
Electricity is one cost among many when a household considers a move. For a household that uses about 1,000 kWh a month, the energy charge difference between Florida and California is about $1,771 per year, as the reference shows. That difference is large, but it sits beside housing, insurance, taxes, and income. The energy cost is easier to manage than some of those, because efficiency measures and plan choices can lower it, but the rate is set by the state and the utility.
A useful framework is to list the annual energy cost for your current usage in each place, then add it to the other costs that matter to your household. The comparison shows the energy share of the total cost of living, which is a clearer basis than the rate alone.
Why averages can mislead
A state average is an average of many households, from small apartments to large homes. A household’s own usage, plan, and location can be very different from the average. The average is most useful as a benchmark, and the bill is the best source for your own cost. Use the averages to see the scale of the difference between states, then use your bills to decide what applies to you.
Time-of-use and tiered plans
Each state has its own plan structure, and the average does not show it. Some Florida and Texas households are on fixed-price retail contracts, while others are on variable or time-of-use plans. California households may be on tiered or time-of-use rates set by the utility, with tiers that change with the season. Compare the energy charge on each bill with the benchmark, and look at the plan’s structure before comparing offers.
A household that can shift use to off-peak hours can lower its bill on a time-of-use plan in any of the three states. The savings depend on the plan’s prices and the household’s flexibility, not only on the state average.
Why the rates differ
The rates reflect several factors. Generation mix and fuel costs, the cost of building and maintaining the grid, the distance electricity travels, the regulatory structure, and the mix of customers all influence the average. California’s rate is affected by its high infrastructure and program costs, while Florida’s and Texas’s rates reflect different market and regulatory structures. A single average cannot explain every difference, but the comparison shows the size of the gap.
Practical steps in any of the three states
Compare the total bill, not only the rate. Add the delivery, fixed, and tax lines before comparing plans.
Manage cooling. Set the thermostat for the season, seal the house, and shade the windows.
Check the plan structure. Look for tiers, time-of-use windows, and any demand charges.
Review the bill each year. Keep the monthly kilowatt-hours and bill totals in one record, so that changes are easy to spot.
Check for programs. Some utilities offer efficiency rebates, discount programs, or time-of-use credits.
Frequently asked questions
Is electricity cheapest in Florida? Among the three states in this comparison, Florida’s EIA August 2026 average is the lowest, at 14.99 cents per kWh.
Is Texas cheaper than California? Yes, on the EIA average. Texas’s average is 15.91 cents, and California’s is 29.75 cents.
Does the average tell me my bill? No. Your bill depends on your usage, your plan, and the fixed and delivery charges on your statement.
Can I compare my bill to these averages? Yes, for the energy charge. Divide the energy charge by the kilowatt-hours, and compare the result with the state benchmark.
What would this cost in your home?
Adjust the starting values to match your appliance and electricity plan.
Sources and method
Monthly energy charge equals kilowatt-hours multiplied by the residential rate in dollars per kWh. The Florida, Texas, California, and U.S. figures come from the EIA Electric Power Monthly, Table 5.6.A for August 2026. The 1,000 kWh reference home, the 1,200 W window air conditioner running 8 hours a day for 31 days, and the 493 kWh refrigerator are planning scenarios, not measurements of any household. Figures exclude delivery, fixed charges, taxes, and plan-specific effects. The U.S. Department of Energy Energy Saver site gives general guidance on home energy use.
For the national benchmark, see our U.S. electricity rates by state hub, and our Texas electricity cost guide.
Written by Seon (Site Founder & Energy Data Researcher / Home Tech Reviewer). Last checked: November 22, 2026. These are calculated estimates from EIA average rates and planning scenarios, not measured results.
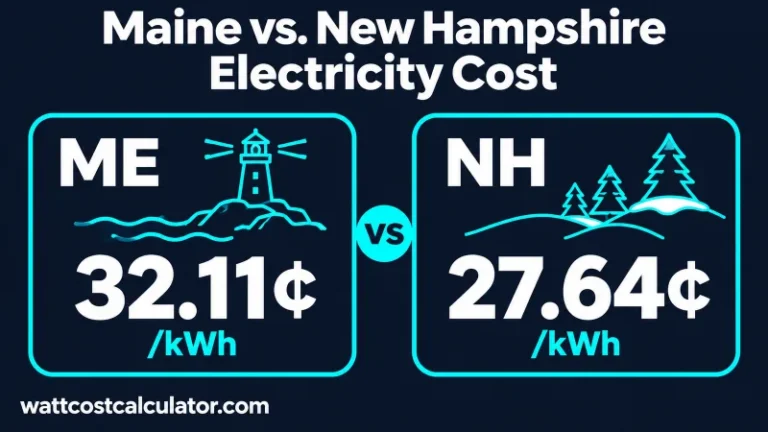
Maine vs. New Hampshire Electricity Cost: Winter Heat Pump & Delivery Bills
Residential electricity in Maine averaged 32.11¢/kWh in August 2026 (EIA), compared with 27.64¢/kWh in New Hampshire—making a 700 kWh monthly bill $31.29...

2026 US State-by-State Electricity Cost Master Guide
Compare electricity prices across U.S. states using EIA data: the five most expensive and cheapest states, plus California, Texas, Florida and New...
U.S. Electricity Rates by State (2026 Comparison Hub)
Compare residential electricity prices in all 50 states and DC, using EIA August 2026 data with August 2025 for comparison, and jump...

Illinois vs Ohio Electricity Cost: Supply Rates and the Total Bill
Table of ContentsHideWhat the same usage costs at state averagesPrice to Compare: a supply benchmark, not the entire billWhy a lower supplier...