

Arizona’s average residential rate is 15.05 cents per kWh, and Nevada’s is 12.72 cents per kWh, both from EIA Table 5.6.A for August 2026. For a reference home that uses 1,000 kWh a month, that is about $150.50 per month in Arizona and $127.20 per month in Nevada, a gap of about $279.60 per year. Both states are below the U.S. average of 18.16 cents. The gap is driven mostly by the rate and by how much cooling a home uses, not by the appliance list alone.
- What the rate comparison does and does not show
- Rates compared with the U.S. average
- A reference household
- How to read your bill in either state
- Seasonal load pattern in a hot climate
- Appliance scenarios at each state’s rate
- Solar and net metering
- Pools, water, and other summer loads
- Cooling is the big driver in both states
- Peak-hour rates and time-of-use plans
- Practical steps for lowering a bill in either state
- Frequently asked questions
- Sources and method
What the rate comparison does and does not show
A state average rate is a simple benchmark. It is the average price a residential customer pays per kilowatt-hour across the state, calculated from utility sales and revenue. It does not include fixed monthly customer charges, taxes, or the separate charges that some utilities apply in certain months. It also does not reflect a time-of-use or demand plan that a specific household may be on. For a household budget, the rate is the starting point, and the bill is what comes after the fixed charges and the plan details are added.
The average also hides differences between utilities within each state. A home served by one utility may pay more or less than the state average, depending on the utility’s rate structure, the local grid, and the programs it offers. Check the rate printed on your bill and compare it with the state average before drawing a conclusion about your own home.
Rates compared with the U.S. average
The table below uses the EIA August 2026 residential figures from Table 5.6.A, with the U.S. average shown for reference.
| Location (EIA August 2026 average) | Rate | Difference from U.S. average |
|---|---|---|
| Arizona | 15.05 cents/kWh | about 3.11 cents lower |
| Nevada | 12.72 cents/kWh | about 5.44 cents lower |
| United States | 18.16 cents/kWh | reference |
Both states sit below the national average. The gap between them is 2.33 cents per kWh. That difference matters more for high-use households than for small ones, because it is multiplied by every kilowatt-hour the home uses.
A reference household
To compare the two states on the same basis, the guide uses a reference home that uses 1,000 kWh per month. This is a planning value, not the average for either state. Monthly energy cost equals kWh multiplied by the rate.
| Reference home (1,000 kWh per month) | Monthly cost | Annual cost |
|---|---|---|
| Arizona (15.05 cents/kWh) | $150.50 | $1,806.00 |
| Nevada (12.72 cents/kWh) | $127.20 | $1,526.40 |
| United States (18.16 cents/kWh) | $181.60 | $2,179.20 |
At 1,000 kWh a month, the Arizona and Nevada bills differ by about $23.30 per month, or about $279.60 per year. The U.S. average is higher in this reference, which is why the state rates matter when you compare a home’s bill with a national figure.
How to read your bill in either state
A residential bill usually has three parts: the energy charge, which is the kilowatt-hours used multiplied by the rate; the delivery or distribution charge; and fixed monthly charges. Some bills also list taxes, fees, and riders. The EIA average rate is closest to the energy charge alone, so compare the energy charge on your bill with the state average rather than the total. Use the same billing period each time, and keep the bill pages for the year so the comparison covers the full seasonal cycle. Dividing the energy charge by the kilowatt-hours used gives your effective rate, which you can then compare with the benchmark in the table above.
Check which billing period the bill covers. Summer bills often cover a hotter period, and a bill that runs over 30 days can show more kilowatt-hours than a bill for 28 days. Compare bills from the same season when you check the change over time. A simple check is to multiply your monthly kilowatt-hours by the state rate in this guide and compare the result with the energy charge on the bill. The two numbers should be close when the bill has no unusual riders. If the numbers differ by a large margin, the bill likely includes a plan or a rider that the average does not reflect, and the utility can explain which one applies to your account.
Seasonal load pattern in a hot climate
Cooling dominates the summer load in both states, while the winter load is usually much smaller. A home with a central air system may see the monthly bill roughly double between a mild month and a hot month, even when the rate stays the same. The seasonal pattern matters for budgeting, because a summer bill can be far higher than the average month, and a rate comparison alone does not capture that change.
Plan for the summer peak. A simple method is to take the highest monthly bill from the last year and set aside that amount for the hottest months, instead of averaging the bill across the whole year.
Appliance scenarios at each state’s rate
The table below applies each state’s rate to three common household loads. The scenarios use planning values for each appliance, and they are not measurements of any specific product.
| Scenario (annual energy) | Arizona (15.05 cents/kWh) | Nevada (12.72 cents/kWh) |
|---|---|---|
| Refrigerator at 493 kWh per year | $74.20 per year | $62.71 per year |
| Dishwasher, one 0.9 kWh cycle a day | $49.44 per year | $41.79 per year |
| Electric vehicle charging, 300 kWh per month | $541.80 per year | $457.92 per year |
The refrigerator row uses the published average of 493 kWh per year for ENERGY STAR refrigerators in one analysis, as a planning value. The dishwasher row uses the scenario in our dishwasher guide. The EV row uses the reference of 300 kWh per month from our EV charging guide, at each state’s rate. A household with an EV can see the rate difference grow to a noticeable amount over a year.
Solar and net metering
Both states have rooftop solar programs, and the rules for net metering or the successor credit programs vary by utility and by date. A household that installs solar should read the program terms carefully, because the value of exported energy can differ from the retail rate shown in the EIA average. The average rate is a useful benchmark for the energy you buy from the grid, but it does not show how a solar system’s output will be credited. Ask the installer and the utility for the specific rules that apply to your interconnection before comparing a solar payback estimate with the rate benchmark.
Pools, water, and other summer loads
A swimming pool pump is one of the larger flexible loads in a hot state. A pump running 8 hours a day at 1,000 W uses 8 kWh per day, or about 240 kWh per 30 days. At Arizona’s average rate, that is about $36.12 per month, and at Nevada’s average rate, it is about $30.53 per month. Running the pump at off-peak hours on a time-of-use plan, and matching the run time to the water quality needs, can reduce the bill. Check the pump’s label for its actual wattage before estimating.
Cooling is the big driver in both states
Both states have hot summers, and cooling is the largest seasonal load in many homes. The air conditioner’s energy use depends on the cooling capacity, the outdoor temperature, the house’s insulation, and how many hours the system runs. In a hot climate, the same unit can run for many hours a day in July and August.
Consider a single 1,200 W window air conditioner running 8 hours a day for 31 days, as a scenario. That is 297.6 kWh for the month. At Arizona’s rate, the cost is about $44.79. At Nevada’s rate, it is about $37.85. The difference is about $6.93 for that one unit in that one month. A whole-house system, running longer and drawing more power, multiplies the same effect.
Cooling efficiency also matters. A unit with a higher efficiency rating uses less electricity for the same cooling. Check the efficiency rating on the unit’s label, and consider a programmable thermostat to avoid running the system at full power when the house is empty.
Peak-hour rates and time-of-use plans
Some utilities in both states offer time-of-use or demand-based plans. Under those plans, electricity can cost much more during the late afternoon and evening, when demand is high, and less overnight. A household on such a plan should look at the peak-hour rate, not only the state average. Shifting a flexible load, such as a dishwasher or a pool pump, out of the peak window can lower the bill even when the state average is low.
Check your utility’s plan options and the schedule of peak hours before choosing a plan. A plan that works well for one household may cost more for another, depending on when the appliances run.
Practical steps for lowering a bill in either state
Raise the thermostat setting when the house is empty. A few degrees of setback during the day can reduce the cooling load, and a programmable or smart thermostat can automate it.
Seal and insulate. Air leaks and poor insulation let cooled air escape, so the system runs longer. Check attic insulation, door seals, and window treatments.
Shade the windows. Blinds, shades, and exterior shading reduce the heat that enters the house, which lowers the cooling load.
Maintain the system. A clean filter and a clean outdoor coil help the system run efficiently. Schedule service on the manufacturer’s recommended interval.
Check your rate plan. Compare the plan options your utility offers. A time-of-use plan may save money for a household that can shift loads to off-peak hours.
Frequently asked questions
Is electricity cheaper in Nevada than in Arizona? On the EIA August 2026 residential averages, yes. Nevada’s average is 12.72 cents per kWh, and Arizona’s is 15.05 cents per kWh.
Does the state average tell me what my bill will be? No. The bill depends on how much you use, your utility’s plan, fixed charges, and taxes. Use the average as a benchmark, and compare it with your own bill.
Why is the cooling load so important here? Cooling is often the largest seasonal load. In a hot climate, a system that runs many hours a day can dominate the summer bill, so efficiency and setback habits matter.
Can I use the calculator for my own home? Yes. Enter the wattage of your largest loads and the hours you run them, then use your utility’s rate from the bill.
What would this cost in your home?
Adjust the starting values to match your appliance and electricity plan.
Sources and method
Monthly cost equals kilowatt-hours multiplied by the residential rate in dollars per kWh. Rates are from the EIA Electric Power Monthly, Table 5.6.A for August 2026. The reference home of 1,000 kWh per month and the 1,200 W window air conditioner running 8 hours a day for 31 days are planning scenarios, not measurements of any household. Figures exclude fixed monthly charges, taxes, and utility-specific plan charges. The U.S. Department of Energy Energy Saver site gives general guidance on cooling and home energy use.
For the national benchmark, see our U.S. electricity rates by state hub.
Written by Seon (Site Founder & Energy Data Researcher / Home Tech Reviewer). Last checked: November 22, 2026. These are calculated estimates from EIA average rates and planning scenarios, not measured results.
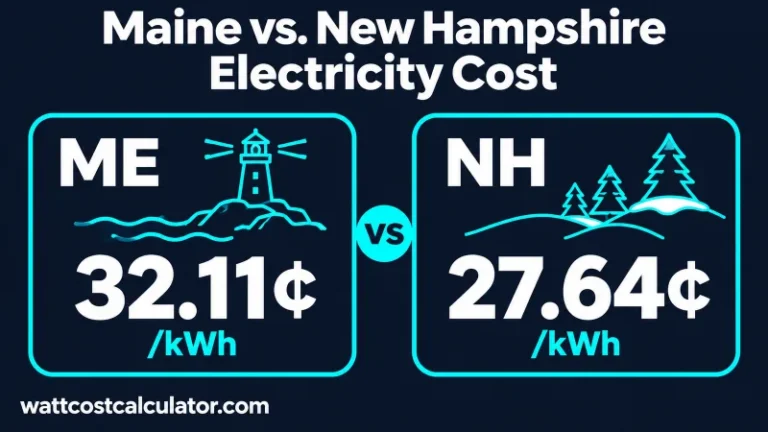
Maine vs. New Hampshire Electricity Cost: Winter Heat Pump & Delivery Bills
Residential electricity in Maine averaged 32.11¢/kWh in August 2026 (EIA), compared with 27.64¢/kWh in New Hampshire—making a 700 kWh monthly bill $31.29...

2026 US State-by-State Electricity Cost Master Guide
Compare electricity prices across U.S. states using EIA data: the five most expensive and cheapest states, plus California, Texas, Florida and New...
U.S. Electricity Rates by State (2026 Comparison Hub)
Compare residential electricity prices in all 50 states and DC, using EIA August 2026 data with August 2025 for comparison, and jump...

Illinois vs Ohio Electricity Cost: Supply Rates and the Total Bill
Table of ContentsHideWhat the same usage costs at state averagesPrice to Compare: a supply benchmark, not the entire billWhy a lower supplier...