

- What equal household usage looks like
- Heating: compare energy delivered, not just nameplate watts
- Tesla Model Y Juniper: home charging in Washington vs. Oregon
- Calculate an appliance at your own rate
- Separate winter heating from EV charging
- What would this cost in your home?
- What to look for on your utility bill
- Does hydropower guarantee a low bill?
- Frequently asked questions
- Sources and dates
Washington and Oregon households share a wet, cool climate, but their electric bills can look different even for the same number of kilowatt-hours. Heating equipment, utility charges and an electric vehicle’s charging needs may matter more than the state average alone.
To see how these states rank against the rest of the country, check out our 2026 US State-by-State Electricity Cost Master Guide.
For all 50 states, see our 2026 U.S. Electricity Rates by State Hub.
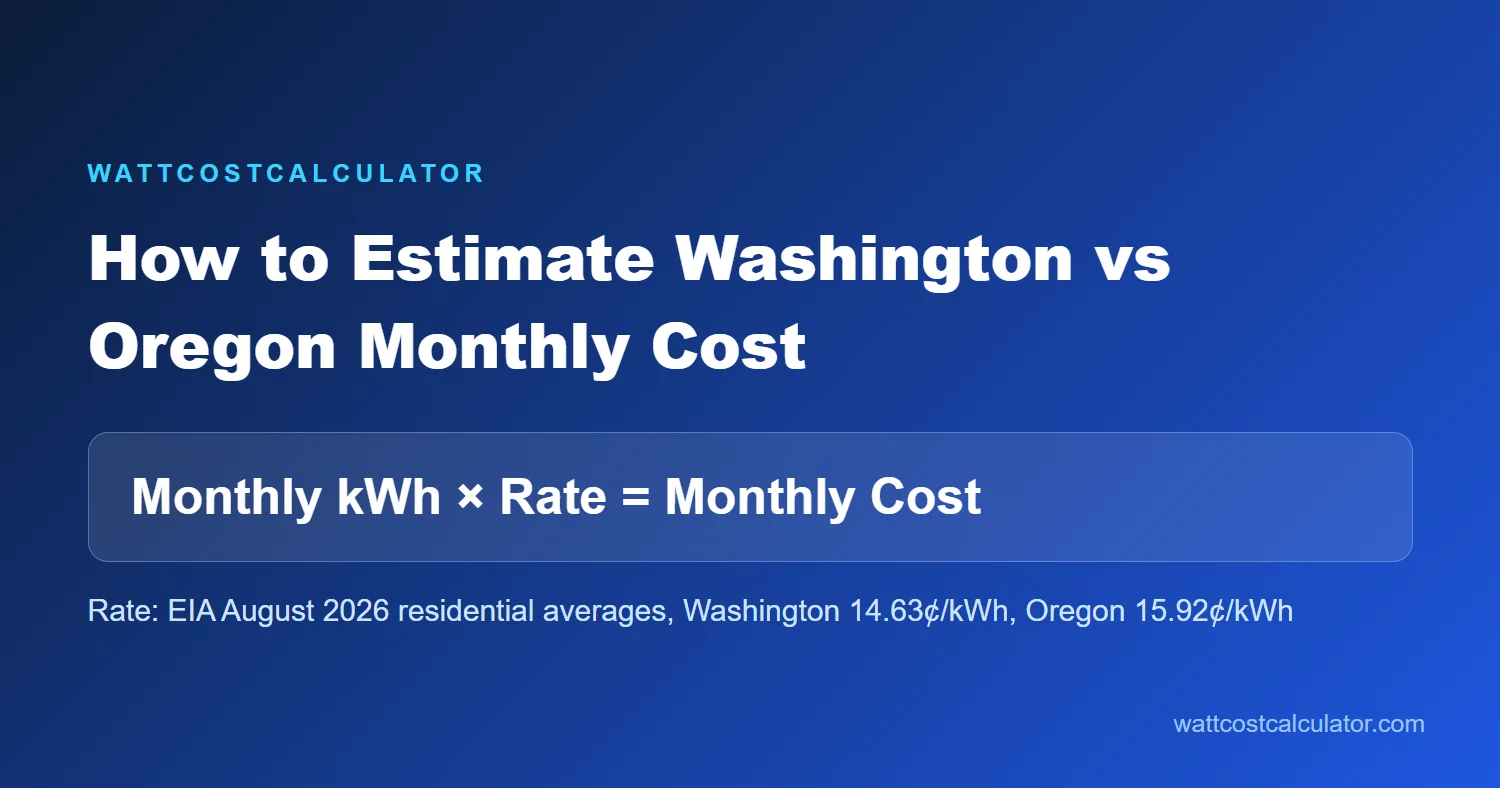
Quick comparison: the U.S. Energy Information Administration (EIA) reports preliminary August 2026 residential averages of 14.63¢/kWh for Washington and 15.92¢/kWh for Oregon. At 1,000 kWh, multiplying by those averages gives $146.30 and $159.20 respectively. These are historical statewide revenue-per-kWh averages, not utility quotes or forecasts of an individual bill.
What equal household usage looks like
| Monthly use | Washington 14.63¢ | Oregon 15.92¢ | Difference |
|---|---|---|---|
| 500 kWh | $73.15 | $79.60 | $6.45 |
| 1,000 kWh | $146.30 | $159.20 | $12.90 |
| 1,500 kWh | $219.45 | $238.80 | $19.35 |
Multiply kWh by the rate in dollars per kWh. Do not add a full fixed fee to these statewide averages: aggregate revenue already reflects a mix of utility charges. Your own total bill can differ because of your provider, billing period, fixed charges, taxes, riders, usage tiers and plan.
Heating: compare energy delivered, not just nameplate watts
Imagine a home needs 1,200 kWh of heat over a cold month. In a simplified illustration, resistance heat consuming 1,200 kWh of electricity costs $175.56 at the Washington reference rate or $191.04 at the Oregon rate. A heat pump with an assumed seasonal coefficient of performance (COP) of 2.0 would use 600 kWh to deliver the same heat, costing $87.78 or $95.52 respectively.
The COP is an illustrative average, not a specification for every machine. Cold weather, defrost cycles, installation, thermostat settings, backup resistance heat and the home’s heat loss can change actual results. The two homes also need not have equal heating demand. See our guide to heat pump backup heat for why auxiliary heat changes the calculation.
Tesla Model Y Juniper: home charging in Washington vs. Oregon
Consider a refreshed Tesla Model Y (often called “Juniper”) driven 1,000 miles a month and charged at home. Tesla’s Model Y design page uses a 28 kWh per 100 miles consumption rating in its savings estimate; the actual figure varies by configuration and conditions. For this worked example, assume the home charging meter records 30 kWh per 100 miles from the wall, including charging losses. This is an illustrative assumption, not a measured result or a claim that 30 kWh is Tesla’s official wall-to-wheel rating.
At 1,000 miles, the assumed wall energy is 300 kWh. Using the August 2026 EIA state averages, that adds approximately $43.89 per month in Washington (300 × $0.1463) or $47.76 in Oregon (300 × $0.1592): a $3.87 difference. For 100 miles, the corresponding costs are $4.39 and $4.78. If using the car’s driving-consumption display instead of a wall meter, allow for charging losses; do not add losses again if your figure already includes them. Cold weather, speed, tires, preconditioning and charging schedule can change the result.
This calculation excludes public charging, charger installation, fixed bill charges and any time-of-use or demand effects. For a more detailed example see home EV charging cost per 100 miles.
Calculate an appliance at your own rate
As an example, a 1,500 W resistance heater at full power for four hours uses 6 kWh. At 14.63¢/kWh that is about $0.88 per day and $26.33 over 30 days. Replace the defaults with the appliance’s measured average draw and your plan’s applicable variable rate; a thermostat can cycle the heater off.
Separate winter heating from EV charging
Start with a mild-month bill to see the baseline. Estimate EV charging from wall kWh and put that energy in its charging window. For example, 150 kWh at a flat 12¢ adds $18. Then price additional heating energy separately using the tier or time window where it lands. This keeps a change in mileage from looking like a change in heating demand. See how to find the applicable rate on your electric bill.
What would this cost in your home?
Adjust the starting values to match your appliance and electricity plan.
Reference: EIA August 2026 preliminary Washington residential average, checked November 9, 2026. To use the Oregon statewide example, enter 15.92¢/kWh. The calculator excludes fixed fees and cannot represent tiered or time-dependent prices automatically.
What to look for on your utility bill
Portland General Electric describes basic, energy and distribution charges on its residential bills. Puget Sound Energy provides a household energy-cost guide and identifies the rate schedule behind its examples. These are two providers—not a description of every utility in either state. Your provider’s current tariff and bill control your cost.
- Find the dates and total kWh on your bill. Divide total cost by kWh only for a rough historical all-in average; fixed charges affect that number.
- For an additional appliance, identify the variable charges that change with the extra kWh. Do not charge the full monthly fixed fee to each appliance.
- If your plan has different prices by hour or usage tier, estimate each portion separately. Confirm whether EV charging changes your applicable tier.
- For heating, use a whole-home meter comparison or dedicated monitoring where available; do not assume a heat pump runs at its rated maximum all day.
Does hydropower guarantee a low bill?
Hydropower is an important part of the Pacific Northwest power system, but it does not determine an individual bill on its own. Utilities have different supply portfolios, infrastructure costs, rate structures and service areas. A lower rate cannot make up for every difference in heating demand, so compare your own usage and tariff before making a decision.
Continue with our electric bill guide, compare California rates and time-of-use costs, or estimate another device on the main calculator.
Frequently asked questions
Does Washington have cheaper electricity than Oregon because of hydropower?
Hydropower is an important part of the Northwest supply mix, but the EIA residential average also reflects utility systems, contracts, transmission and other costs. A statewide average cannot predict a specific household’s bill or prove the cause of a price difference.
Do the state averages include public utility district customers?
EIA state residential averages aggregate reported residential revenues and sales; they are not a tariff for one utility or service territory. PUD customers can have different rates, fixed fees and seasonal schedules, so use the rate on your own bill.
Why is my bill higher than the state average?
The average price per kWh does not capture every reason a bill differs. Your usage, heating system, delivery-area charges, fixed fees, taxes, billing days, time-of-use plan and weather all matter. Compare the same billing period and separate fixed charges from usage-linked charges.
Sources and dates
- EIA Electric Power Monthly, Table 5.6.A — preliminary August 2026 residential averages.
- Portland General Electric: understanding your bill — bill components.
- Puget Sound Energy: home energy cost guide — utility examples and rate schedule reference.
- U.S. Department of Energy: air-source heat pumps — heat-pump operation and efficiency.
For all 50 states, see our 2026 U.S. Electricity Rates by State Hub.
Disclaimer: The figures on this page use statewide or standardized averages and the inputs shown. They are for general information only, not a utility quote, a bill, or financial advice. Check your own electricity bill and the official EIA or manufacturer sources for current figures.
Maine vs. New Hampshire Electricity Cost: Winter Heat Pump & Delivery Bills
Residential electricity in Maine averaged 32.11¢/kWh in August 2026 (EIA), compared with 27.64¢/kWh in New Hampshire—making a 700 kWh monthly bill $31.29...

2026 US State-by-State Electricity Cost Master Guide
Compare electricity prices across U.S. states using EIA data: the five most expensive and cheapest states, plus California, Texas, Florida and New...
U.S. Electricity Rates by State (2026 Comparison Hub)
Compare residential electricity prices in all 50 states and DC, using EIA August 2026 data with August 2025 for comparison, and jump...

Illinois vs Ohio Electricity Cost: Supply Rates and the Total Bill
A supplier advertises electricity for 10 cents per kilowatt-hour. Should a 1,000-kWh month cost $100? The supply portion might be about that...