

- Why GPU wattage is not your monthly bill
- Measure the whole system in the states you actually use
- Three example schedules and costs
- Estimate your own daily-average power
- Add each operating state once
- What would this cost in your home?
- When is leaving it on worth it?
- Frequently asked questions
- Sources and assumptions
Home AI server electricity cost depends on the whole computer’s measured wall power and how long it spends idle versus generating answers—not the graphics card’s maximum rating multiplied by 24 hours. For a transparent example, a system drawing 65 watts while idle for 20 hours and 300 watts at the outlet during four hours of AI work uses about 2.5 kWh a day. At the U.S. residential average of 18.16 cents per kWh, that is about $13.62 per 30 days, or $165.71 per year. These are illustrative inputs, not a measurement of a typical AI server.
If you are deciding whether to leave a local model running all day, the first useful question is how much power the complete system draws while it waits. This guide shows how to measure that number, estimate a mixed-use day, and decide whether always-on access is worth the cost.
Why GPU wattage is not your monthly bill
A graphics card’s published power figure describes the card, not the full computer at the wall and not its average draw around the clock. NVIDIA lists 360 watts of Total Graphics Power for its reference GeForce RTX 5080 and an 850-watt recommended system power for a specified configuration. Neither number says that every RTX 5080 computer continuously draws that amount from an outlet. The CPU, motherboard, memory, storage, cooling, power supply, workload, and idle state all affect the reading.
Local AI also covers very different workloads. A small quantized model answering occasional prompts may spend most of the day idle; a larger model, multiple GPUs, or batch jobs can keep the system busy longer. DeepSeek’s own R1 project documents several distilled model sizes and gives a multi-GPU example for its 32B model. Do not assume every model runs comfortably on any single graphics card; requirements depend on model size, quantization, context, and software. Choose the model and hardware first, then measure that setup.
Measure the whole system in the states you actually use
- Use a plug-in energy meter that is rated for your computer’s voltage, current, and plug type. Connect the entire PC to it; include the monitor only if you want the monitor in the estimate.
- Record a normal idle reading after startup tasks settle. If the machine serves requests remotely, leave it in the same ready state you expect to use.
- Run a representative local task for long enough to capture a typical inference period, then record the system’s power or accumulated kWh. Different prompts, model sizes, token rates, and GPU settings can change the result.
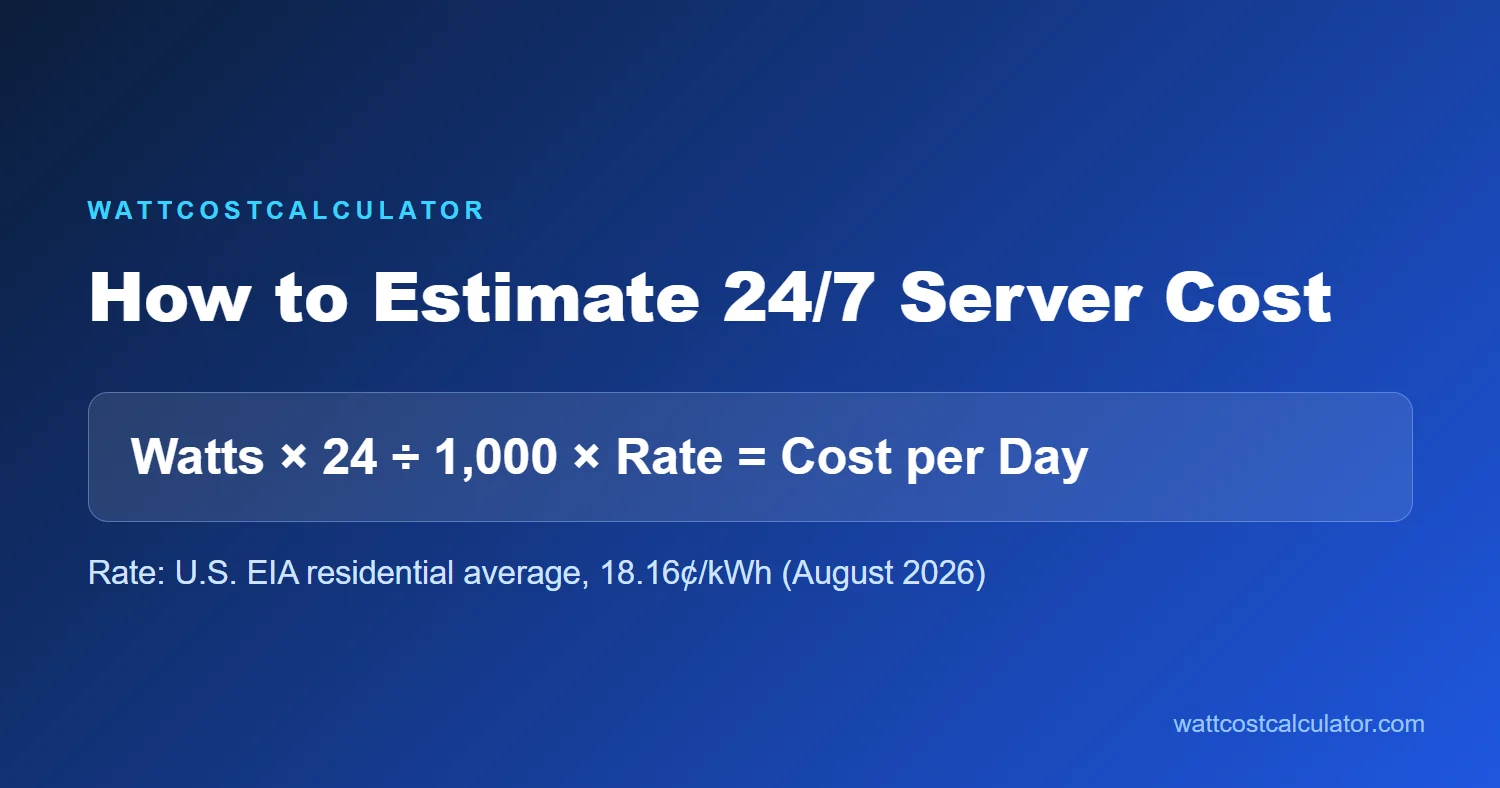
- For a full-day total, an energy meter’s accumulated kWh is simplest. If you have separate average power readings, multiply watts by hours for each state, add the watt-hours, and divide by 1,000.
Daily kWh = (idle watts × idle hours + AI-work watts × AI-work hours + other states) ÷ 1,000
Keep the computer’s state hours within 24 hours. Measure a monitor separately if it is not included in the PC’s outlet reading. Use an appropriate meter and follow its rating; an ordinary plug-in meter is not for hardwired or 240-volt equipment.
Three example schedules and costs
The following examples use 65 watts at the wall for idle and 300 watts at the wall during active AI work. They are deliberately simple inputs to show how schedules change the estimate, not benchmark results or typical-use claims. The rate is EIA’s August 2026 U.S. residential average, 18.16 cents per kWh. Your marginal rate, time-of-use schedule, and bill charges may differ.
| Example schedule | Estimated energy per day | 30-day cost | 365-day cost |
|---|---|---|---|
| 65 W idle for 24 hours | 1.56 kWh | $8.50 | $103.41 |
| 65 W idle for 20 hours + 300 W active for 4 hours | 2.50 kWh | $13.62 | $165.71 |
| 300 W active for 24 hours | 7.20 kWh | $39.23 | $477.27 |
For the middle row: (65 × 20 + 300 × 4) ÷ 1,000 = 2.5 kWh per day. At 18.16 cents, that works out to about 45 cents per day. The 30-day and 365-day amounts are energy charges only; fixed fees, taxes, demand charges, and rate tiers are excluded.
Estimate your own daily-average power
If your meter reports total energy across a representative day, divide that kWh reading by 24 and multiply by 1,000 to get a daily-average wattage. For example, 2.5 kWh over 24 hours is about 104.2 watts on average. Enter that average and 24 hours below. This converts the mixed idle/work day into one average input; it does not mean the server draws 104 watts every moment.
Add each operating state once
A server drawing 65 W for 20 hours and 300 W for four hours uses 2.5 kWh per day. If the router or storage enclosure is on a separate outlet, add that draw separately. If the wall meter already covers the entire power strip, do not add those devices again.
What would this cost in your home?
Adjust the starting values to match your appliance and electricity plan.
To compare a different machine, enter the average wall power from your own meter and your actual marginal electricity rate. The calculator estimates a daily, 30-day, and yearly energy charge. It excludes fixed fees and other bill items.
When is leaving it on worth it?
Our practical view: if the model is only used occasionally, measure the idle draw before shopping for a more efficient GPU. The server may spend far more hours waiting than generating text, so idle power and whether you need instant remote access can matter more to your yearly cost than a short peak-power test. If quick access is not important, scheduling sleep or shutdown after jobs finish is a simple comparison to test. If the machine must stay available, compare the measured annual cost with the value you get from local access, privacy, or uninterrupted service.
These energy estimates are not a recommendation to compromise safe cooling, system updates, or hardware limits. They also do not include purchase price, repairs, internet equipment, or any extra cooling in the room. A server’s heat eventually becomes room heat, which may change air-conditioning use in warm weather; that secondary effect depends on the home and is not included here.
For context on a gaming computer’s idle, work, gaming, and sleep states, see our Gaming PC electricity cost guide. For a separate 24/7 device comparison, read Router, modem, and mesh Wi-Fi electricity cost. Then use the Appliance Electricity Cost Calculator with your own rate.
Frequently asked questions
Does a 360 W graphics card use 360 W all day?
No. That figure is a graphics-card power specification, not a whole-system daily average. The GPU’s state changes with workload, and the rest of the computer contributes to the outlet reading. Measure the complete setup in its idle and working states.
Can I multiply the power supply’s rated watts by 24?
No. A power supply’s watt rating describes its capacity, not the computer’s continuous consumption. Use an outlet energy meter or a correctly configured power measurement tool, and calculate from real operating states.
Is a home AI server always more expensive than cloud AI?
Electricity is only one part of that comparison. Hardware cost, model access, usage volume, cloud pricing, maintenance, and whether local processing is important to you all matter. This page estimates electricity only; it does not claim a universal break-even point.
Related reading: For a gaming-focused alternative to AI workloads, see our RTX 5080 versus RTX 3080 electricity comparison.
Sources and assumptions
- NVIDIA GeForce RTX 5080 specifications — GPU power and recommended system power figures; used to explain why a component specification is not a measured PC bill.
- DeepSeek-R1 official repository — model variants and local-use documentation.
- U.S. Energy Information Administration, August 2026 electricity prices — residential average of 18.16¢/kWh.
Checked November 9, 2026. The estimate uses the stated idle and workload power assumptions. Actual wall power varies by hardware, model, settings, prompt workload, and system state. The cost examples use stated assumptions and exclude non-energy bill charges.
Disclaimer: The figures on this page use statewide or standardized averages and the inputs shown. They are for general information only, not a utility quote, a bill, or financial advice. Check your own electricity bill and the official EIA or manufacturer sources for current figures.

Cat Water Fountain Electricity Cost: Monthly Cost by Pump Wattage
A cat water fountain costs about $0.13 to $0.39 a month at 18.16¢/kWh if its pump runs 24 hours at 1 to...

CPAP Machine Electricity Cost: Heated Humidifier & Heated Tube Impact
Running a CPAP machine for 8 hours a night costs roughly $0.65 per 30-day month ($7.95/year) with humidification off, or $2.58 per...

Christmas Lights Electricity Cost: LED vs. Incandescent Holiday Displays
Lighting 600 incandescent mini Christmas bulbs for 6 hours a night costs roughly $7.85 per 30-day month at 18.16¢/kWh, whereas an equivalent...

Robot Vacuum & Auto-Empty Wash Dock Electricity Cost: Charging vs. Hot-Air Drying
A basic charging-only robot vacuum costs roughly $0.46 per 30-day month ($5.62/year) at 18.16¢/kWh, while an all-in-one mop-washing and hot-air drying station...