
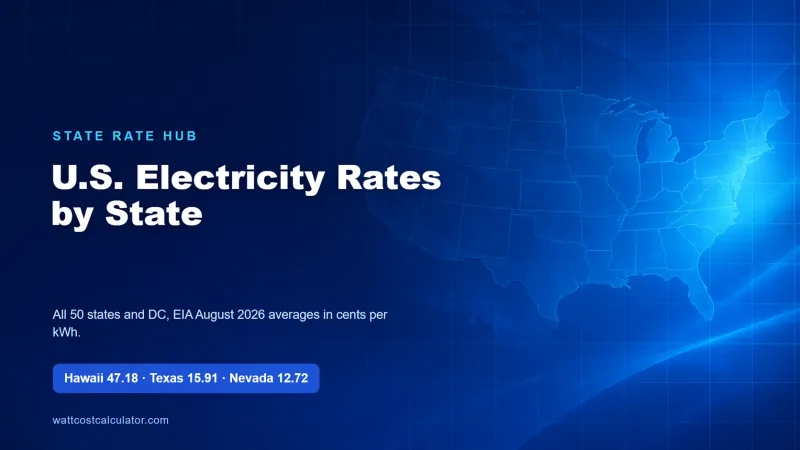
Electricity is priced very differently from one state to the next. This hub puts all 50 states and the District of Columbia in one table, so you can see the residential average price, how it changed from a year earlier, and which detailed comparison guide to read next.
How to use this table
The figures are average residential prices in cents per kilowatt-hour (¢/kWh) from the U.S. Energy Information Administration (EIA), Electric Power Monthly, Table 5.6.A, for August 2026, with August 2025 for comparison. An average is not your bill. Your own rate depends on your utility, your plan, fixed fees, taxes and how you use electricity.
To estimate an appliance, use the Appliance Electricity Cost Calculator, enter your own rate from your bill, and compare the result with the state average.
U.S. residential electricity prices by state (August 2026)
| State | Aug 2026 (¢/kWh) | Aug 2025 (¢/kWh) | Change (¢) | Guide |
|---|---|---|---|---|
| Alabama | 16.33 | 16.26 | +0.07 | |
| Alaska | 29.41 | 27.79 | +1.62 | |
| Arizona | 15.05 | 15.09 | -0.04 | Compare |
| Arkansas | 14.37 | 13.33 | +1.04 | |
| California | 29.75 | 30.92 | -1.17 | Compare |
| Colorado | 17.17 | 16.21 | +0.96 | |
| Connecticut | 24.51 | 30.17 | -5.66 | Compare |
| Delaware | 18.70 | 16.85 | +1.85 | |
| District of Columbia | 25.98 | 23.18 | +2.80 | |
| Florida | 14.99 | 15.33 | -0.34 | Compare |
| Georgia | 15.90 | 15.55 | +0.35 | Compare |
| Hawaii | 47.18 | 38.53 | +8.65 | |
| Idaho | 13.37 | 12.08 | +1.29 | |
| Illinois | 19.32 | 18.03 | +1.29 | Compare |
| Indiana | 17.02 | 16.21 | +0.81 | |
| Iowa | 17.06 | 15.48 | +1.58 | |
| Kansas | 15.47 | 14.65 | +0.82 | |
| Kentucky | 13.80 | 13.10 | +0.70 | |
| Louisiana | 12.87 | 12.55 | +0.32 | |
| Maine | 32.11 | 28.14 | +3.97 | |
| Maryland | 21.40 | 19.89 | +1.51 | |
| Massachusetts | 30.48 | 30.55 | -0.07 | Compare |
| Michigan | 22.99 | 20.73 | +2.26 | |
| Minnesota | 17.20 | 16.89 | +0.31 | |
| Mississippi | 14.43 | 13.61 | +0.82 | |
| Missouri | 16.02 | 15.32 | +0.70 | |
| Montana | 15.57 | 14.29 | +1.28 | |
| Nebraska | 13.54 | 12.80 | +0.74 | |
| Nevada | 12.72 | 12.54 | +0.18 | Compare |
| New Hampshire | 27.64 | 24.44 | +3.20 | |
| New Jersey | 24.61 | 24.70 | -0.09 | Compare |
| New Mexico | 16.51 | 15.98 | +0.53 | |
| New York | 28.65 | 26.64 | +2.01 | Compare |
| North Carolina | 14.95 | 14.59 | +0.36 | Compare |
| North Dakota | 13.31 | 12.97 | +0.34 | |
| Ohio | 19.38 | 17.55 | +1.83 | Compare |
| Oklahoma | 14.82 | 14.42 | +0.40 | |
| Oregon | 15.92 | 15.85 | +0.07 | Compare |
| Pennsylvania | 21.77 | 19.93 | +1.84 | Compare |
| Rhode Island | 28.18 | 26.53 | +1.65 | |
| South Carolina | 15.76 | 15.16 | +0.60 | |
| South Dakota | 15.15 | 13.90 | +1.25 | |
| Tennessee | 13.42 | 13.09 | +0.33 | |
| Texas | 15.91 | 15.40 | +0.51 | Compare |
| Utah | 13.31 | 13.62 | -0.31 | |
| Vermont | 23.84 | 22.10 | +1.74 | |
| Virginia | 17.64 | 15.85 | +1.79 | |
| Washington | 14.63 | 13.65 | +0.98 | Compare |
| West Virginia | 16.31 | 15.62 | +0.69 | |
| Wisconsin | 19.41 | 18.44 | +0.97 | |
| Wyoming | 14.43 | 14.33 | +0.10 |
What stands out
Hawaii has the highest average in this table at 47.18 ¢/kWh, up from 38.53 a year earlier. Alaska, Maine, Rhode Island and New Hampshire are also well above the national middle range. Several states at the low end, such as Louisiana, Nebraska, North Dakota and Utah, were near 13 ¢/kWh. Connecticut fell the most over the year, from 30.17 to 24.51 ¢/kWh, so a single year can change the ranking.
Detailed State-by-State Comparisons
Each pair below has its own guide with the supply, delivery and total bill explained, and worked examples for the same appliance in each state:
- Washington vs Oregon electricity cost: heating and EV use
- Maine vs New Hampshire electricity cost: winter heat pump and delivery bills
- Illinois vs Ohio electricity cost: supply rates and the total bill
- New Jersey vs Connecticut electricity cost: supply, delivery and total bill
- Georgia vs North Carolina electricity cost: how utility bills compare
- Arizona vs Nevada electricity cost: peak hours and summer bills
- Florida vs California and Texas electricity cost: compare rates across three large states
Other state guides: New York, Pennsylvania, Massachusetts, California and Texas. For how to read a bill line by line, see How to Read a U.S. Electric Bill.
Regional patterns
New England. Maine (32.11 ¢/kWh), Massachusetts (30.48) and Rhode Island (28.18) sit at the top of the mainland range in August 2026. New Hampshire rose from 24.44 to 27.64 ¢/kWh over the year, so winter heating and delivery charges matter more here than the supply price alone. Our Massachusetts guide explains how winter heating adds to the bill.
Middle Atlantic. New York (28.65 ¢/kWh) is higher than the regional neighbors, while Pennsylvania (21.77) and New Jersey (24.61) are lower. New Jersey barely moved year over year, from 24.70 to 24.61 ¢/kWh, but Pennsylvania rose from 19.93 to 21.77. Shopping a supply offer can change the bill in Pennsylvania and New Jersey, but the delivery charge stays with the utility. Read our New Jersey vs Connecticut and Pennsylvania guides before you compare offers.
Midwest. Illinois (19.32 ¢/kWh) and Ohio (19.38) are almost identical in August 2026, yet both rose by more than a cent over the year. Michigan (22.99) is among the higher Midwest states, while Nebraska (13.54), North Dakota (13.31) and South Dakota (15.15) are among the lowest. Our Illinois vs Ohio guide shows why the total bill can differ from the supply rate.
South. Most southern states sit in the 12 to 17 ¢/kWh range. Texas (15.91) and Georgia (15.90) are close, and Florida (14.99) is slightly lower than both. Louisiana (12.87) and Tennessee (13.42) are among the lowest in the country. Air conditioning drives summer usage in this region, so the rate matters less than how many hours the unit runs. Our Florida vs California and Texas guide and Georgia vs North Carolina guide show the same appliance across these states.
Mountain and Southwest. Colorado (17.17) and New Mexico (16.51) are above the regional average, while Utah (13.31), Idaho (13.37) and Nevada (12.72) are lower. Arizona (15.05) and Nevada differ in peak-hour pricing and summer use, so the same appliance can cost more or less depending on when it runs. See our Arizona vs Nevada guide for the time-of-use examples.
Pacific. California (29.75 ¢/kWh) and Hawaii (47.18) lead the country among states with large populations, and Alaska (29.41) is also high. Oregon (15.92) and Washington (14.63) are much lower, which is why the Washington vs Oregon comparison is useful for people deciding whether to move. California fell slightly year over year, from 30.92 to 29.75 ¢/kWh.
How to compare your own rate with the state average
Start with your bill and find the price per kilowatt-hour. Many bills show a supply charge, a delivery charge and taxes separately. The EIA average is usually an all-in residential figure, so compare your total cost per kWh with it, not only the supply line. If your plan uses time-of-use pricing, compare the peak and off-peak rates separately, because the average hides that difference.
Once you have your rate, enter it in the calculator together with the appliance’s watts and daily hours. For example, a 1,500 W space heater running 8 hours a day uses 12 kWh per day. At 18.16 ¢/kWh, that is about $2.18 a day. Changing only the rate to 24 ¢/kWh raises the same daily cost to about $2.88. The difference is useful when you compare a state average with your own plan.
Why the August figures matter
EIA data is reported with a lag, and the monthly figures can move a lot from one season to the next. A rate that looks high in August can be lower in a mild month, and the reverse is true in winter. This is why we show both August 2026 and August 2025, and why each state guide names its reference month. If you read this hub after a newer EIA release, check the official table for the latest month.
Method and sources
State averages come from EIA Electric Power Monthly, Table 5.6.A (August 2026 and August 2025). The table is updated when EIA publishes a new month. We record the reference month in each guide so readers know which figures they are reading. EIA may revise its data. Check the official EIA table for the latest numbers.
Disclaimer: The figures on this page use statewide or standardized averages and the inputs shown. They are for general information only, not a utility quote, a bill, or financial advice. Check your own electricity bill and the official EIA or manufacturer sources for current figures.
Frequently asked questions
Where do these state averages come from?
The figures come from the U.S. Energy Information Administration (EIA), Electric Power Monthly, Table 5.6.A. This page uses the August 2026 data, which EIA released on October 23, 2026, and compares it with August 2025.
Will my bill match the state average?
Usually not. The average is total residential revenue divided by total residential sales. Your bill can include a different rate, delivery charges, fixed fees and taxes, so use your own bill for a personal estimate.
How often is this table updated?
When EIA publishes a new month, the table and the state guides are checked and updated. Each guide names the month it uses, so you can see which data a figure comes from.
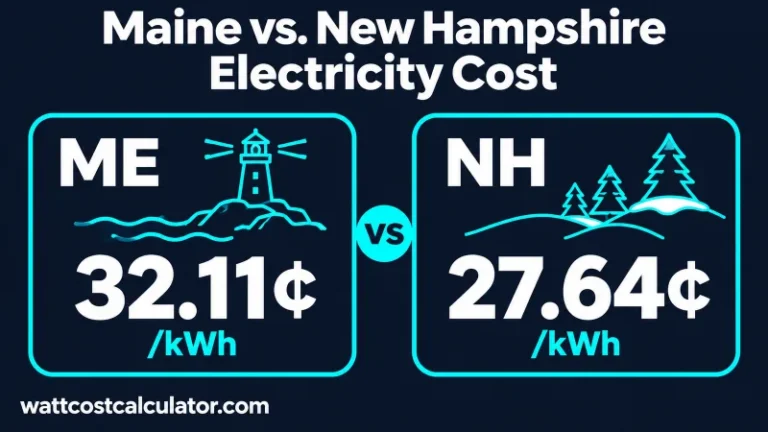
Maine vs. New Hampshire Electricity Cost: Winter Heat Pump & Delivery Bills
Residential electricity in Maine averaged 32.11¢/kWh in August 2026 (EIA), compared with 27.64¢/kWh in New Hampshire—making a 700 kWh monthly bill $31.29...

2026 US State-by-State Electricity Cost Master Guide
Compare electricity prices across U.S. states using EIA data: the five most expensive and cheapest states, plus California, Texas, Florida and New...
Illinois vs Ohio Electricity Cost: Supply Rates and the Total Bill
A supplier advertises electricity for 10 cents per kilowatt-hour. Should a 1,000-kWh month cost $100? The supply portion might be about that...

Washington vs Oregon Electricity Cost: Heating and EV Use
Washington and Oregon households share a wet, cool climate, but their electric bills can look different even for the same number of...